Day 171: Whirly Tubes
 College-Prep Physics: A student project investigating the relationship between the rotational speed of a whirly tube and the pitch produced. The student used a Vernier microphone and Logger Pro to produce an FFT graph which indicated the pitch of the note produced. The student used the video camera on her iPhone to record the twirling so she could get an accurate number for the rotational speed in RPMs.
You can read more about the physics of whirly tubes here: http://www.exo.net/~pauld/summer_institute/summer_day13music/Whirly.html
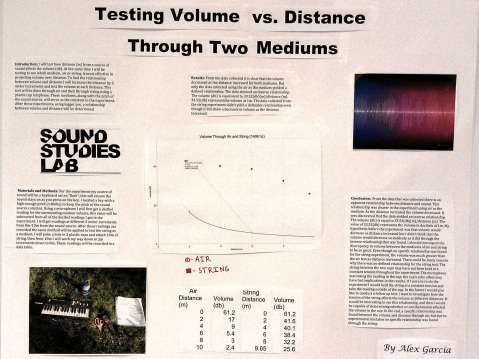
Day 170: Sound Volume vs. Distance for 2 Different Media

College-Prep Physics: A student project examining how volume varies with distance. Is it inverse square like light and gravity? Is it different in different media? The student used a Casio keyboard to play a sustained note and used a Vernier sound meter to measure decibel levels at various distances. To test a different medium, the student used to cups connected by string, and used various length of string between the cups.
The sound using the cups and string was always louder than in air at the same distance, but it didn’t drop off in the same way as in air. We wonder whether the tension in the string might have something to do with it. Our reasoning being, if the string is more taught, the sound travels faster through the string and reaches the end with less decrease in amplitude, and therefore would sound louder. It is likely that the tension in string wasn’t held constant for different length string.
Day 167: Examining Doppler Shift in Logger Pro

 College-Prep Physics: One student is looking at the relationship between the speed of her car and the apparent shift in the frequency of the horn. She used her iPhone to video her dad driving the car and honking the horn (yay for parental involvement!). Then in school, she played back the video on her phone and held a Vernier microphone to the iPhone speaker. Looking at the FFT graphs created by LoggerPro, she was able to see the shift in pitch at various approaching and receding speeds.
TIP: We used the LoggerPro template file called “Mathematics of Music” found in the “Physics with Vernier” folder. The FFT graph will display the whole spectrum and indicate the peak (loudest) frequency. However, we found that sometimes, depending on the exact moment when we sampled the horn, the different frequencies in the horn’s spectrum were the peak frequencies, even though all the same frequencies were present on repeated samplings.
We discovered this because the student was originally looking solely at peak frequency and was finding an inconsistent pattern between car speed and pitch. So I helped her out and looked at her data. By looking at the whole spectrum (rather than just the peak frequency), we could see see the “fingerprint” of the horn. Then we could map the shift in the “fingerprint” for different speeds.
Day 165: Boomwhackers and Helium
 College-Prep Physics: A student is investigating pitch vs. tube length for Boomwhackers. The pitch (frequency, in hertz) is measured with a Vernier microphone and FFT analysis in LoggerPro. Yesterday he did it for air-filled boomwhackers with an end-cap. Today he’s repeating the experiment using boomwhackers with helium. Will there be a difference?
