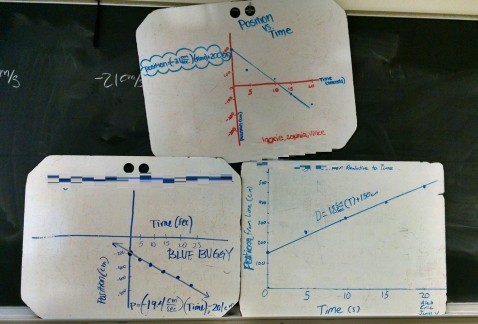
Day 10: Buggy Lab 2 Whiteboards
 College-Prep Physics: Today we whiteboarded the second run through the buggy lab, this time focusing on position, not distance. What’s similar about the graphs? What’s different? What does the slope mean? How are these different than the graphs from the first buggy lab?
##CVPM
NGSS Science and Engineering Practice 4: Analyzing and Interpreting Data
Day 8: Buggy Lab Part 2
College-Prep Physics: Someone once said, “Any lab worth doing is worth doing twice.”
The traditional modeling physics materials have students do the buggy lab once, finding the relationship between position and time. I’ve found that kids don’t understand the difference between position and distance right away and end up taking distance data instead. So, for the first buggy lab, I just let them roll with their intuition and they take distance and time data for both fast and slow buggies.
Before we do the second buggy lab, I show them this picture and ask them to write down the position of each car in as many ways possible. (We haven’t formally discussed position yet, but I want them thinking on their own first.)
After they’ve shared answers, we look to see what qualities were common in all the positions they listed (distance, direction, and origin/reference point). NOW, we can define position and NOW we re-do the buggy lab, but in terms of position.
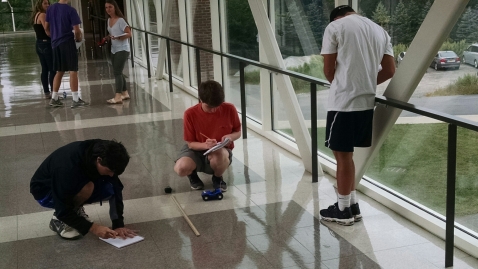
And unlike the first buggy lab, where everyone looked at the same situation (red and blue buggy distances), for the re-do each group investigates a different situation. I lay down a common origin in the hall (green tape), and groups get a red (fast) or blue (slow) buggy, each with a different starting position and travel direction:
- Blue heading south from 200 cm north
- Blue heading north from 150 cm north
- Red heading south from 100 cm north
- Red heading north from 50 cm north
- Red heading north from 50 cm south
- Red heading south from 100 cm south
- Blue heading north from 150 cm south
- Blue heading south from 200 cm south
Because they already did the first buggy lab in terms of the distance traveled, they are quick to see that the re-do is different and we’re tracking position relative to the green tape. On Monday, we’ll graph the data using Desmos and share results.
NGSS Science and Engineering Practice 3: Planning and Carrying Out Investigations
Day 5: Buggy Lab
College-Prep Physics: Data collection for the buggy lab today!
“How far do toy buggies travel?”
“It depends.”
“It depends on what?”
“If there’s obstacles in the way, how much time the buggy is turned on for, how fast the buggy is, how charged the batteries are, friction, etc.”
Design an experiment to determine how time affects how far each toy buggy travels.
(a) Make a pictorial representation of your experimental design.
(b) Make a table of your data.
(c) Plot your data on a graph.
(d) Determine the equation of the trendline.
##CVPM
NGSS Science & Engineering Practice 3: Planning and Carrying Out Investigations


